In the vast landscape of mathematics, diagrams are like visual roadmaps that guide us through complex concepts, making abstract ideas tangible. Join us on a visual journey as we explore the diverse types of diagrams that illuminate the world of math, turning numbers and equations into captivating images.
1. Number Line: Mapping the Numeric Universe
– What is a Number Line?
The number line is a fundamental diagram in math, a straight line where numbers are placed according to their value. It helps us visualize the order and relative distance between numbers.
– Applications:
- Understanding inequalities.
- Visualizing addition and subtraction.
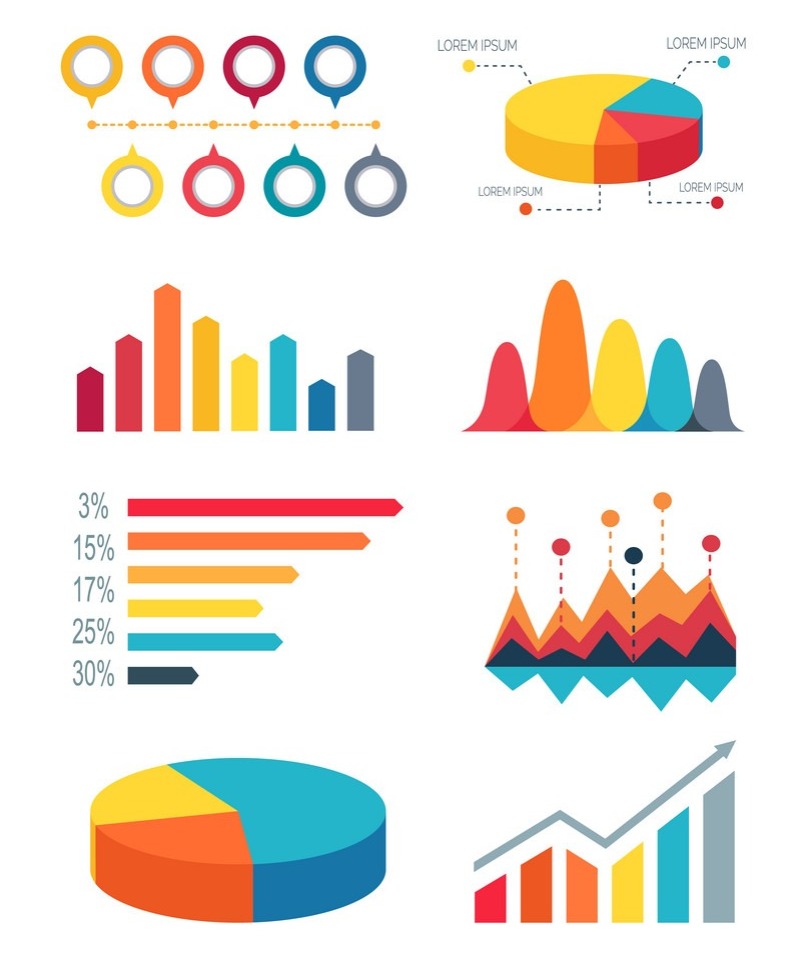
2. Bar Graphs and Histograms: Picture-Perfect Representations
– What are Bar Graphs and Histograms?
Bar graphs display data using rectangular bars, while histograms show the distribution of numerical data using bars of varying heights.
Learn more about bar graphs here
– Applications:
- Comparing data sets.
- Analyzing frequency distributions.
3. Pie Charts: Slices of Proportional Goodness
– What is a Pie Chart?
A pie chart represents data in a circular graph, with each sector or slice illustrating the proportion of the whole that each category represents.
– Applications:
- Displaying percentages and proportions.
- Comparing parts of a whole.
4. Line Graphs: Tracing Trends and Patterns
– What is a Line Graph?
A line graph displays data points on a Cartesian plane, connecting them with lines to show trends and changes over time.
– Applications:
- Depicting trends and patterns.
- Analyzing data over a continuous interval.
5. Venn Diagrams: Overlapping Insights
– What is a Venn Diagram?
Venn diagrams use overlapping circles to represent relationships between different sets, showcasing intersections and differences.
– Applications:
- Visualizing set relationships.
- Solving problems involving multiple sets.
6. Coordinate Plane: Navigating Space with X and Y
– What is a Coordinate Plane?
The coordinate plane is formed by two perpendicular lines, the x-axis and y-axis, intersecting at the origin. It’s the foundation for plotting points in space.
– Applications:
- Graphing equations and functions.
- Analyzing geometric shapes in space