Part 1: What Are Graphs?
Graphs are visual representations of data that help us understand and interpret information. Imagine you have a bunch of numbers or facts that you want to share with others. Instead of bombarding them with a list of numbers, you can use graphs to tell a story that is both engaging and easy to grasp.
Part 2: Types of Graphs
There are different types of graphs, each serving a unique purpose. Let’s explore a couple of the coolest ones:
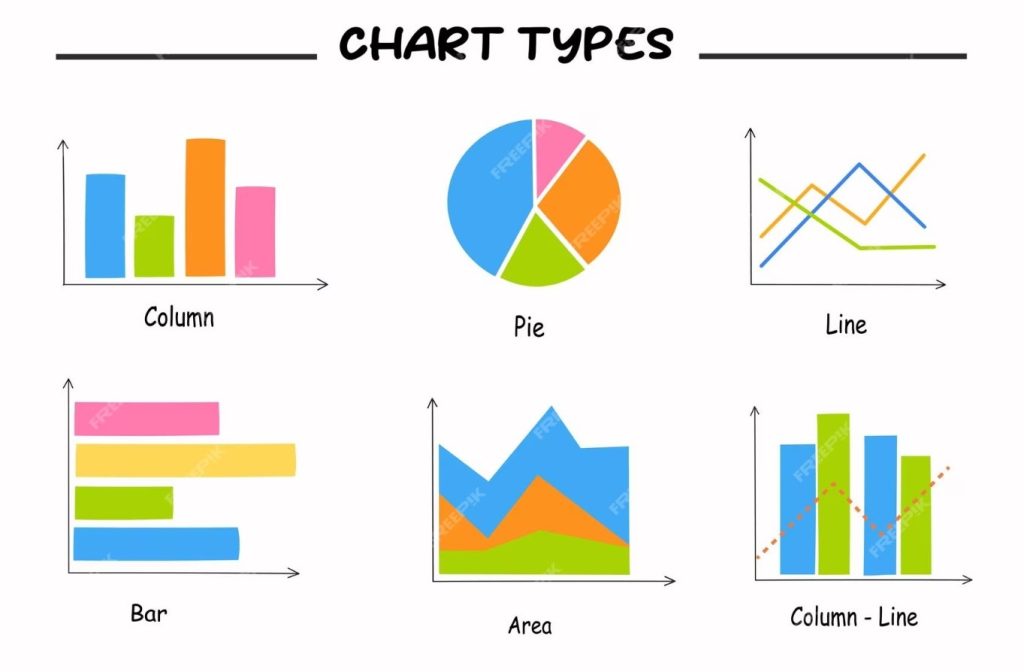
- Bar Graphs: These are like colorful skyscrapers that represent data using vertical or horizontal bars. They’re perfect for comparing things like your favorite ice cream flavors or the number of hours you spend playing different sports.
- Pie Charts: Imagine a delicious pizza divided into slices. Each slice represents a part of the whole. Pie charts help us see how something is divided into smaller sections, like the percentage of your day spent on different activities.
Part 3: How to Create Your Own Graph
Creating your own graph is a piece of cake! All you need is a bit of data and some creativity. Follow these simple steps:
- Gather Data: Start by collecting information you want to share. It could be your toy collection, the number of books you’ve read, or even the types of fruits in your lunchbox.
- Choose the Right Graph: Depending on your data, pick the type of graph that suits it best. Are you comparing things? Go for a bar graph. Do you want to show how something is divided? A pie chart is your friend.
- Draw Your Graph: Get out some paper, and markers, and let your artistic side shine! Draw your graph using the data you collected. Add colors and labels to make it visually appealing.
- Share Your Story: Now, proudly show off your creation! Explain what your graph is about and why it’s interesting. Your friends and family will be amazed at how you turned ordinary numbers into a visual masterpiece.
Part 4: Fun Graph Games
Learning about graphs can also be a blast with some exciting games. Here are a couple of suggestions:
- Graph Bingo: Create bingo cards with different types of graphs. Call out data points, and the first one to fill a row or column shouts “Bingo!”
- Graph Puzzles: Turn data sets into puzzles. Challenge your friends to solve them by creating the corresponding graph.